Mean Species Abundance (MSA): a key indicator for biodiversity
    MSAOrigineIndicatorsPollution

    Mean Species Abundance (MSA): a key indicator for biodiversity

    Mean Species Abundance (MSA) measures the integrity of biodiversity in a given area. This indicator helps monitor biodiversity and the impact of human activities on habitats. But what exactly does the MSA represent and what are its sub-indicators?

    Read the article
    18/10/2024Of 3Bee, Lisa Santillo
    2240 Views
    18/10/2024Of 3Bee, Lisa Santillo
    2240 Views

    Che cos’è il Mean Species Abundance (MSA)?

    The Mean Species Abundance (MSA) is a indicator that is fundamental for assessing the quality of biodiversity in an ecosystem. This indicator expresses the richness and distribution of species compared to a natural state, unaffected by human activities. The MSA is based on a comparison between the current state of an ecosystem and its original or 'reference' state. The value of the MSA varies on a scale from 0 to 100, where 100 indicates an undisturbed ecosystem, in which species abundance is comparable to the natural state, while 0 represents an ecosystem that is completely degraded or in which the original species have disappeared. This tool makes it possible to effectively assess the impact of human activities on natural habitats and to track the evolution of biodiversity over time.

    sirfide

    Origin and use of Mean Species Abundance (MSA)

    The MSA was developed as part of the GLOBIO project, an international initiative initiated by the United Nations Environment Programme (UNEP) to monitor biodiversity globally. The main objective was to create an indicator that could assess the impact of human activities on natural ecosystems in the long term. Since then, the MSA has been used in numerous global and national studies to measure the diversity loss caused by factors such as deforestation, urban sprawl and pollution. It is a key tool for policy-makers, companies and conservation agencies, as it provides a quantitative assessment of the state of biodiversity and helps to identify areas for protection and restoration action.

    biodiversità
    XNatura

    Mean Species Abundance (MSA) sub-indicators

    The MSA is a complex indicator and can be decomposed into sub-indicators to analyse the impact of different anthropogenic pressures on biodiversity. The first is the MSA by Land Use (MSA_LU), which measures the impact of land use changes (e.g. urbanisation, agriculture) on species abundance. Land use is one of the main drivers of diversity loss, and this indicator can detect how far an area deviates from its natural state. The MSA for habitat fragmentation, on the other hand, quantifies how fragmented the ecosystem is and how this affects the presence of species. Habitat fragmentation reduces the connectivity between species populations, resulting in a decrease in their abundance. Both of these sub-indicators play a key role in determining how far an ecosystem deviates from its original condition.
    inquinamento

    MSA for pollution and over-exploitation of resources

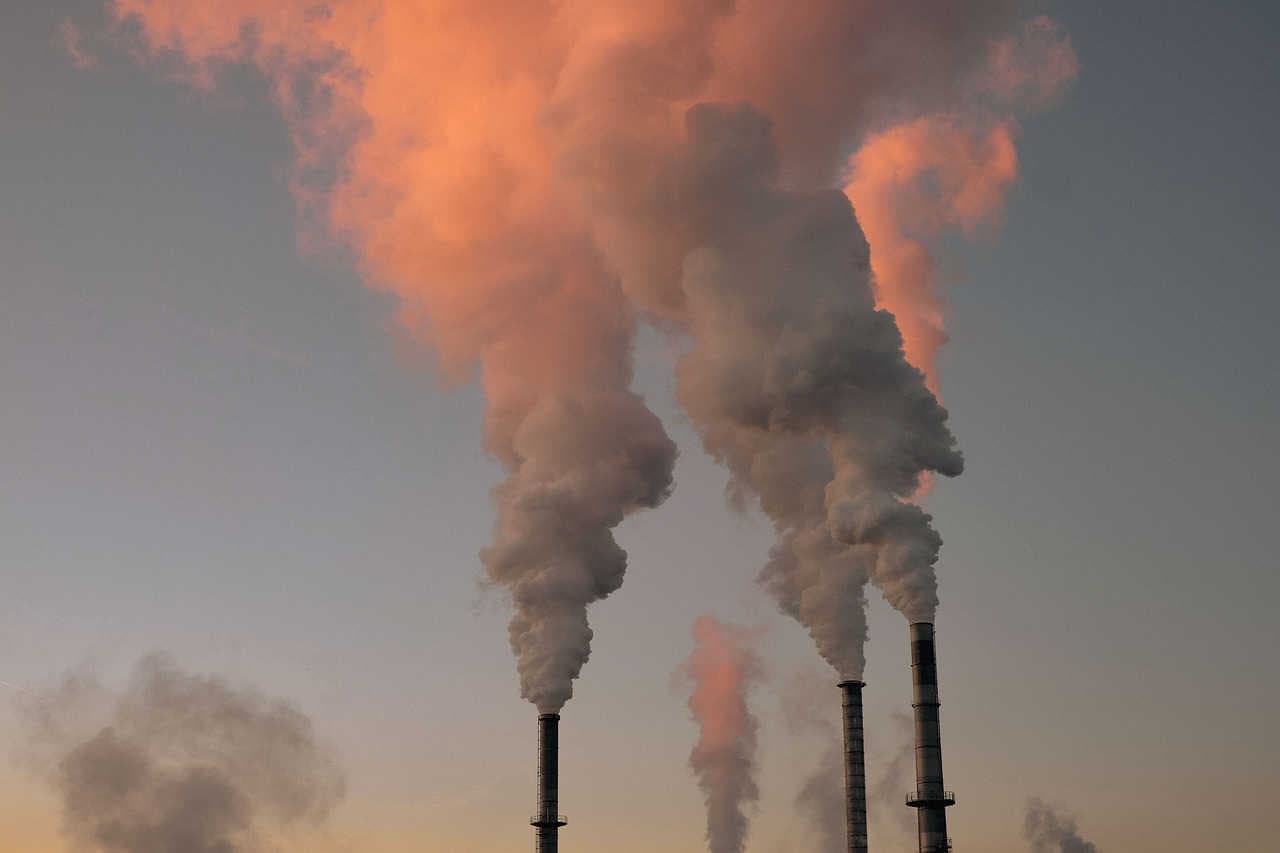
    Pollution is another factor that can drastically reduce species abundance. The MSA for pollution in fact measures the effect of pollutants (air, water, soil) on local biodiversity. Pollutants, such as pesticides, chemical fertilisers or industrial emissions, can alter habitats, reduce water quality or cause bioaccumulation of toxic substances, which adversely affect fauna and flora. In parallel, over-exploitation of resources, such as deforestation, intensive fishing or hunting, can lead to a drastic reduction in plant and animal species. The MSA for resource overexploitation measures the long-term effects of such practices on biodiversity decline, taking into account not only the amount of species present, but also their ability to reproduce and survive over time.
    cambiamento climatico
    XNatura

    MSA for climate change and infrastructure

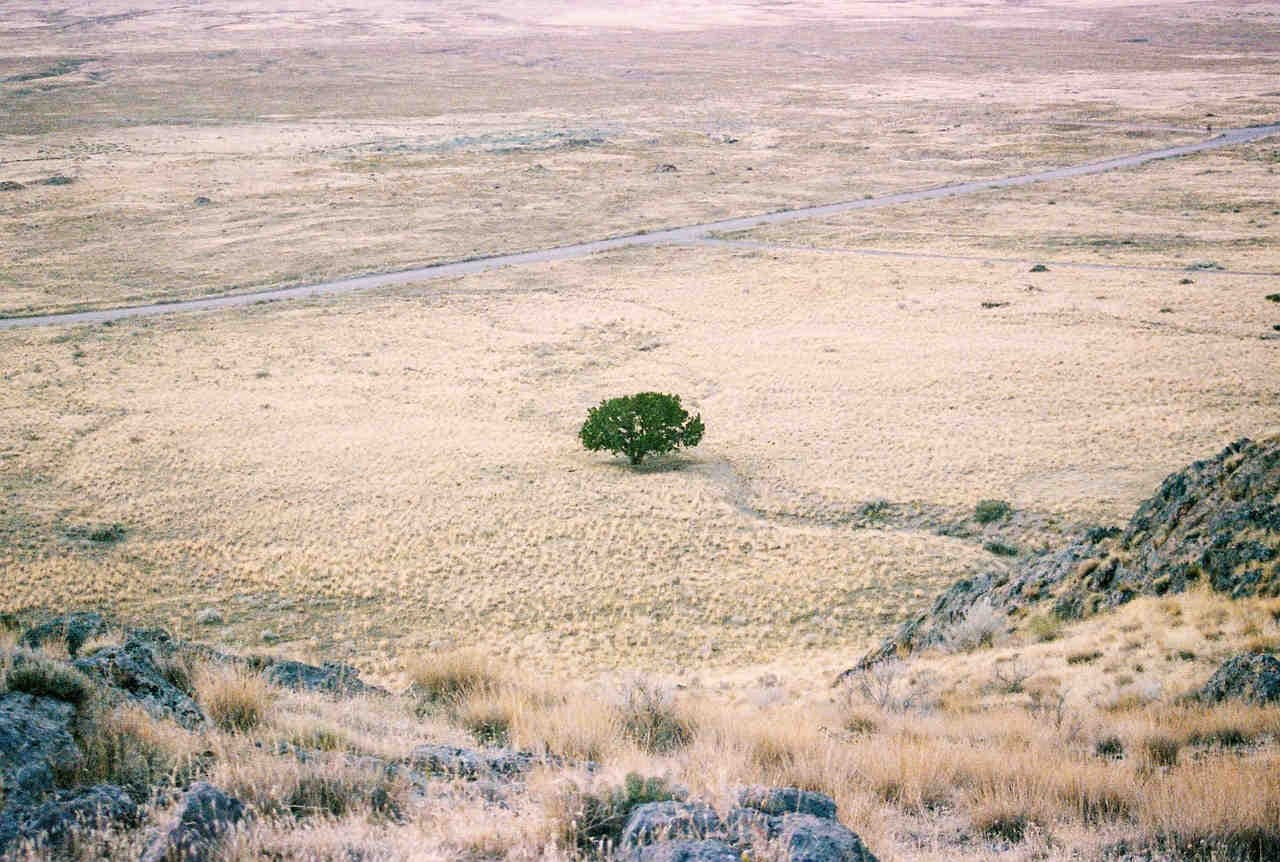
    Another key sub-indicator of the MSA concerns climate changes, which are altering habitats globally. Climate variations, such as the rise in temperatures and the alterations in precipitation patterns, have significant impacts on ecosystems. The MSA for climate change assesses the loss of biodiversity caused by these factors. The MSA for infrastructure, on the other hand, assesses the impact of human infrastructure, such as roads, railways, buildings and other constructions, on the biodiversity of an area. This indicator measures the reduction in species abundance compared to a natural or reference state without anthropogenic impacts.
    parrocchetto
    3Bee

    MSA for invasion of alien species

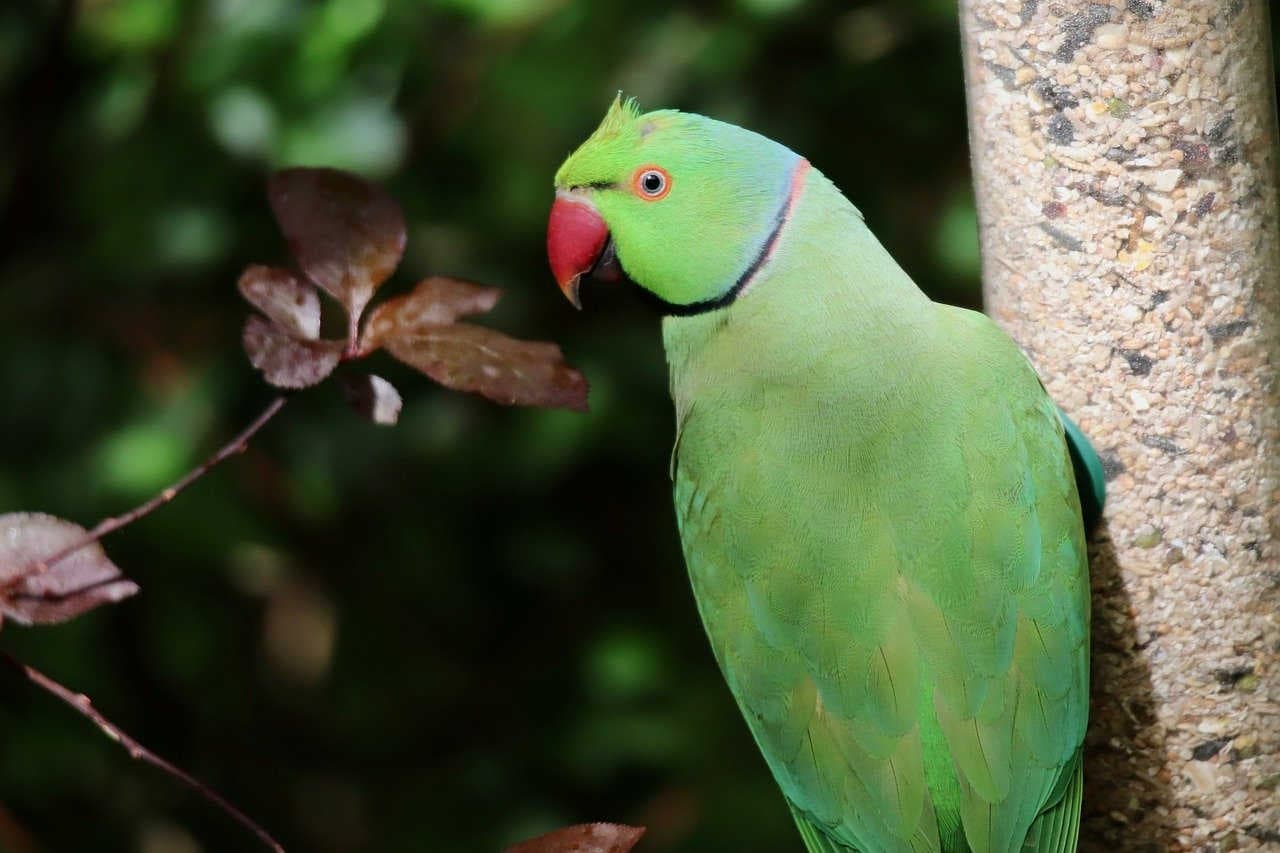
    Finally, there is the phenomenon of native species, i.e. the introduction of species into ecosystems where they were not previously present. Invasive species, lacking natural predators, can rapidly supplant native species, profoundly altering local biodiversity. The MSA for invasion by non-native species measures the impact of non-native species on local species abundance, providing an indication of how much the introduction of these species can reduce the presence of native species. However, it should be specified that the MSA for invasion of non-native species is not part of the GLOBIO model.
    3Bee Environmental Platform

    3Bee Environmental Platform: Biodiversity, Climate & Nature

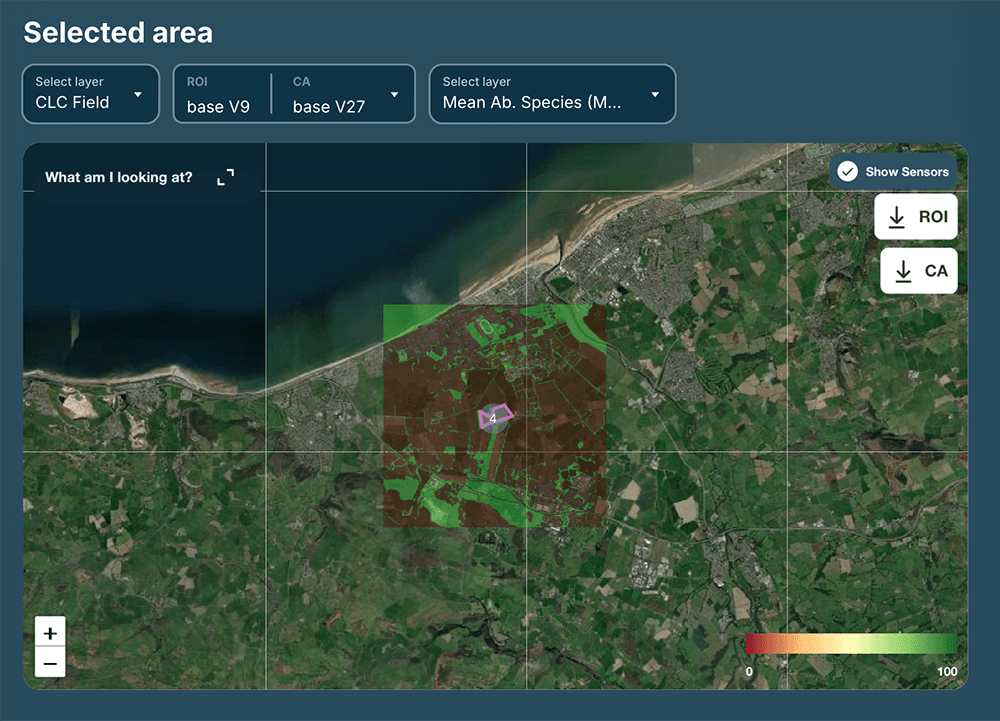
    The assessment of land use and its implications for biodiversity from the MSA Land Use is part of the biodiversity assessment carried out by 3Bee as part of the new Environmental Platform that enables companies, municipalities and nature parks to derive a customised climate strategy based on the analysis of their impacts and dependencies on nature, biodiversity and climate. The 3Bee platform, whose processes and protocols were developed in collaboration with ESA (European Space Agency), was created in response to the growing regulatory and compliance needs of companies, which are now faced with a new challenge: measuring and reporting their impact on nature, biodiversity and climate by following stringent regulations such as the CSRD Directive and major international reporting standards. These require companies to adopt a structured approach to ecosystem risk management.
    3Bee Environmental Platform

    3Bee Environmental Platform for your climate strategy

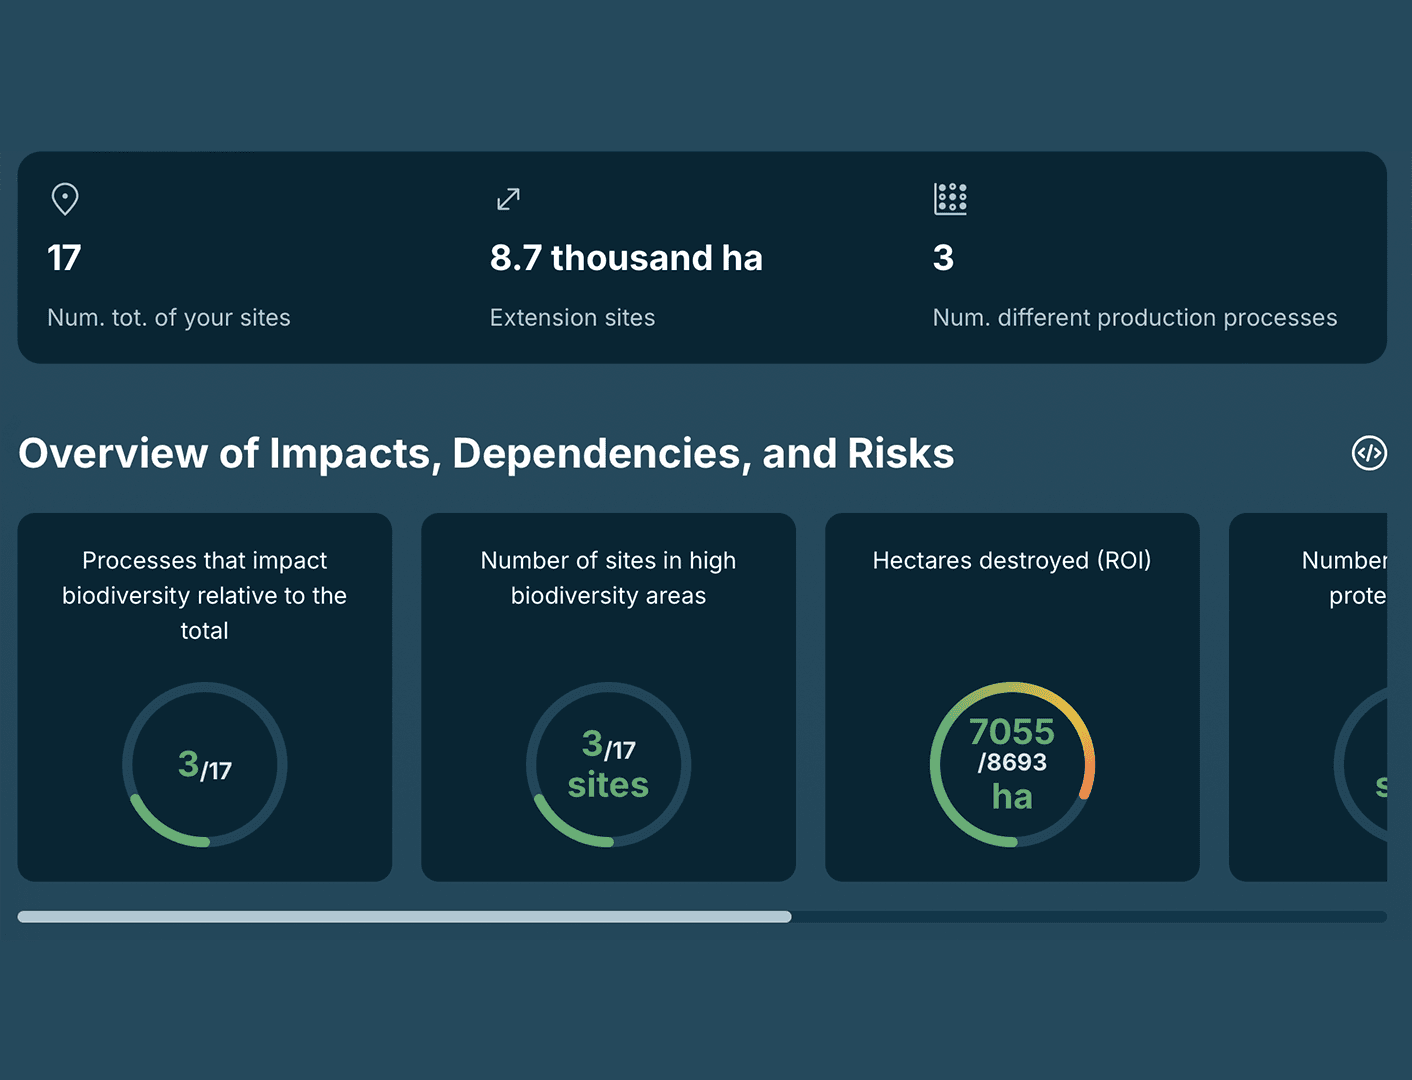
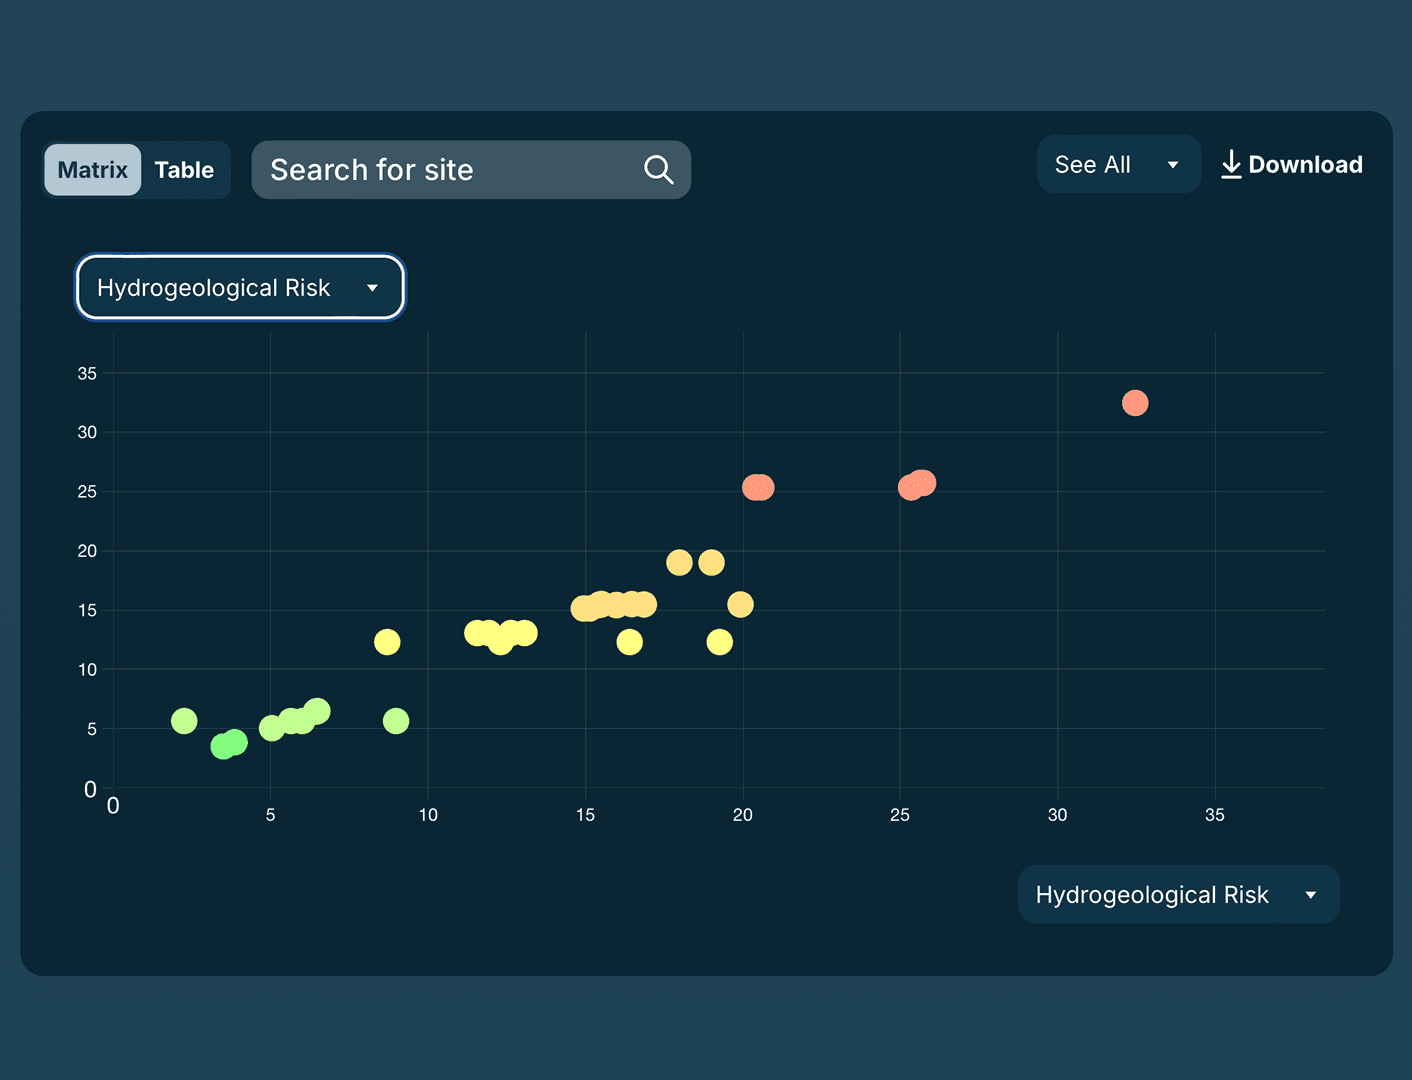
    The 3Bee Environmental Platform thus enables the development of a comprehensive climate strategy: the platform assigns a risk score that highlights which of its sites need priority action, guiding strategic planning in accordance with the CSRD directive and international standards, including ESRS E4 and GRI 101. In particular, 3Bee aggregates data to return four key indices: Nature Impact Risk, which measures the resilience of businesses and municipalities to climate change and natural adversity; Nature Dependencies Risk, which estimates the dependencies of businesses and municipalities on key ecosystem services through a dual materiality analysis; Climate & Physical Risk, which assesses the impact of corporate activities on habitats with high biodiversity and endangered species; Biodiversity Risk, which monitors the overall impact of all corporate sites on ecosystems and nature.
    3Bee Environmental Platform

    From assessment to regeneration strategy

    The 3Bee Environmental Platform makes use of advanced technologies, combining satellite data, field technology and public databases to return an accurate and timely assessment of impacts and dependencies. In just 15 minutes, an accurate snapshot of the current state of an ecosystem can be obtained, identifying the most critical areas requiring urgent action. This quickness is essential to better manage resources and respond in a timely manner to the needs of the territory. After an initial assessment phase, a Biodiversity Strategist, a technical figure in the 3Bee team trained to accompany partners in the definition of a tailor-made biodiversity regeneration and conservation strategy, intervenes.

    18/10/2024Of 3Bee, Lisa Santillo
    2240 Views
    Newsletter
    newsletter
    Subscribe to the Blog about bees and biodiversity

    Frequently Asked Questions

    Do you have any doubts or other curiosities about this article? Here you will find some insights