Biodiversity Around My Home: the free map of species within your 5 km
    What is it?The MSA IndexThe SpeciesTry it now

    Biodiversity Around My Home: the free map of species within your 5 km

    Enter an address and the Biodiversity Around My Home tool will provide you with the observed species, the MSA index, and diversity indicators within a 5 km radius. It is the free tool from iLoveNatura, designed for consultants, biologists, and nature enthusiasts.

    Read the article
    28/05/2026Of 3Bee, 3Bee
    70 Views
    28/05/2026Of 3Bee, 3Bee
    70 Views

    What is the iLoveNatura tool and how does it work?

    <Biodiversity Around My Home> is a free tool from the <iLoveNatura> platform by 3Bee. Enter any address and within seconds you get a snapshot of nature within a 5 km radius.

    The tool aggregates data from open scientific sources: iNaturalist for species observations, IUCN Red List for conservation status, CORINE Land Cover by Copernicus for land use, and GBIF for biogeographical occurrences.

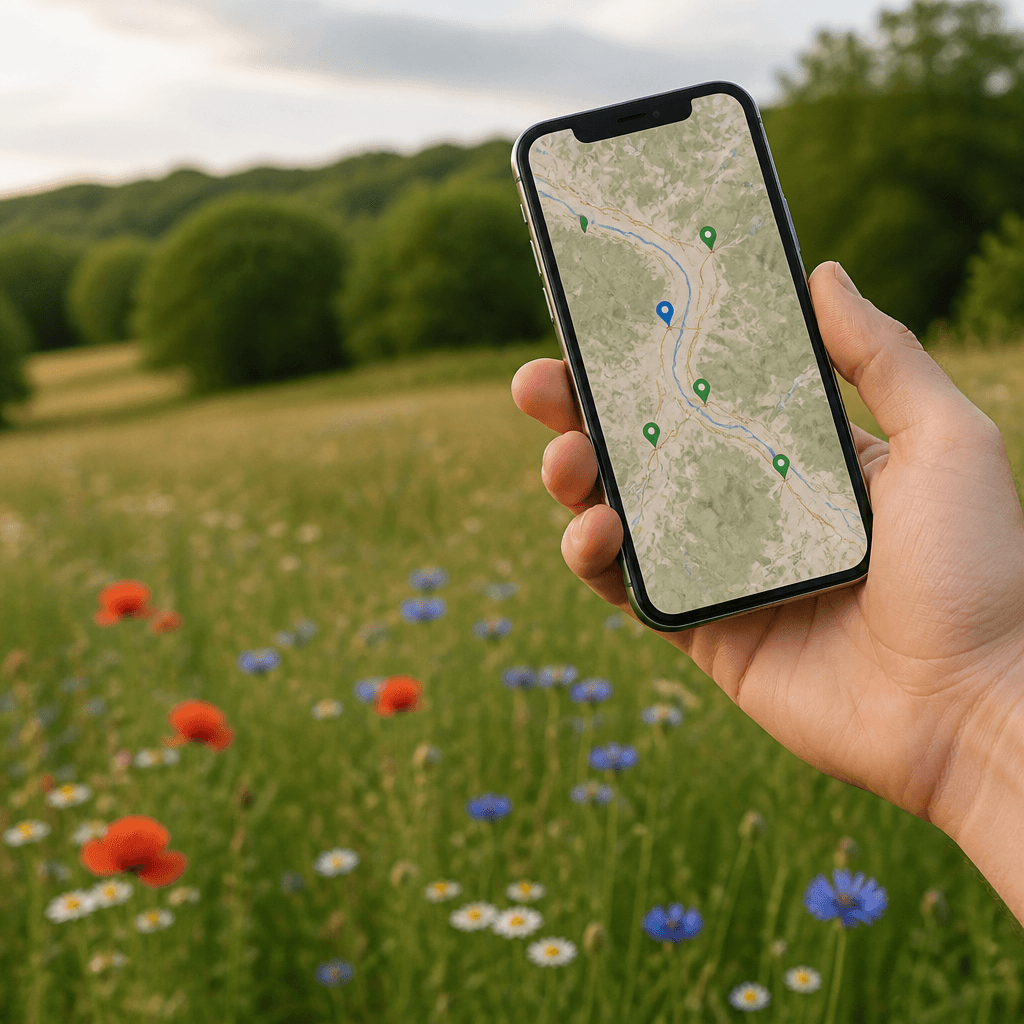
    Once the area is loaded, you find three things: the species inventory with Flora and Fauna filters, sub-filters for taxa, text search, and a grid with photos and IUCN status; the biodiversity indices calculated on the observed data; an interactive map of observations with clusters and a detail drawer for each species, including a heatmap.
    What is the iLoveNatura tool and how does it work?

    MSA Index: Measuring Pressures on Nature

    The quantitative core of the tool is the MSA index (Mean Species Abundance), a synthetic measure of the naturalness of the area: 100% represents an intact ecosystem, 0% a completely compromised ecosystem.

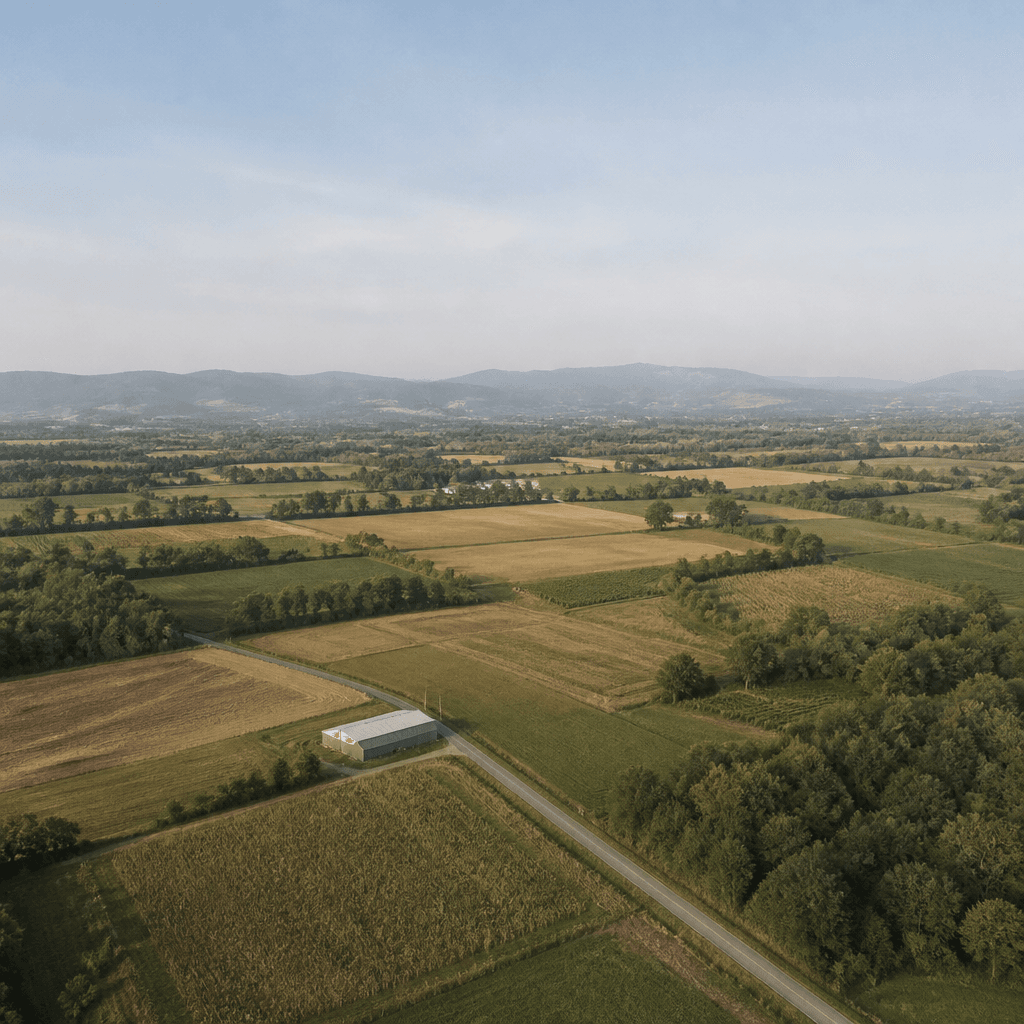
    The value is calculated based on CORINE Land Cover and broken down into the four main pressure factors, in order to understand why an area is worse off compared to the reference:

    • Land Use: intensive agriculture, urbanisation, artificial areas
    • Climate Change: alterations in temperature and precipitation
    • Infrastructure: road and rail networks, man-made structures
    • Fragmentation: dispersion and isolation of natural habitats

    The breakdown is what makes the tool useful in practice: an Environmental Impact Assessment or a due diligence not only need a score, they need to know where to act.
    MSA Index: Measuring Pressures on Nature
    XNatura

    Species, Shannon, and IUCN Red List

    Alongside the MSA index, the tool calculates the classic diversity indices of ecology: Shannon, Simpson, and Evenness. These are numbers that indicate how much and how species are distributed in the area, and they only make sense when read together: for example, a high Shannon value with low Evenness signals an area that is rich but dominated by a few species.

    Each index is segmented into three categories: native, alien, and endemic species. Knowing how much of the diversity we measure is due to introduced species completely changes the ecological interpretation of the territory.

    There is also a graph dedicated to the conservation status according to the IUCN Red List: percentages of species that are critically endangered, endangered, vulnerable, near threatened, of least concern, and with insufficient data. For each species, the detail drawer shows photos, classification, a possible link to iNaturalist, and a heatmap of observations: useful both in the office and in the field.

    Species, Shannon, and IUCN Red List

    Who needs it and how to try it for free

    The tool is designed for those who work with the land and for those who simply want to understand where they live:

    • Environmental consultants: EIA, screening, due diligence, rapid baselines for projects
    • Ecologists and biologists: species composition, spatial analysis, site comparison
    • Urban planners and designers: assessment of development sites and infrastructure
    • Nature enthusiasts: understand what lives within your 5 km and why

    Each analysis consumes 1 credit; upon registration, iLoveNature offers 10 free credits, enough for initial explorations. For more structured projects, packages start from €19.90.

    You can share each analysis with a free link (colleagues do not consume credits to view it) and export a report in PDF, HTML or DOCX to attach to a report.

    Try it now for free: choose an address you know well and see what it returns.
    Who needs it and how to try it for free
    XNatura
    28/05/2026Of 3Bee, 3Bee
    70 Views
    Newsletter
    newsletter
    Subscribe to the Blog about bees and biodiversity