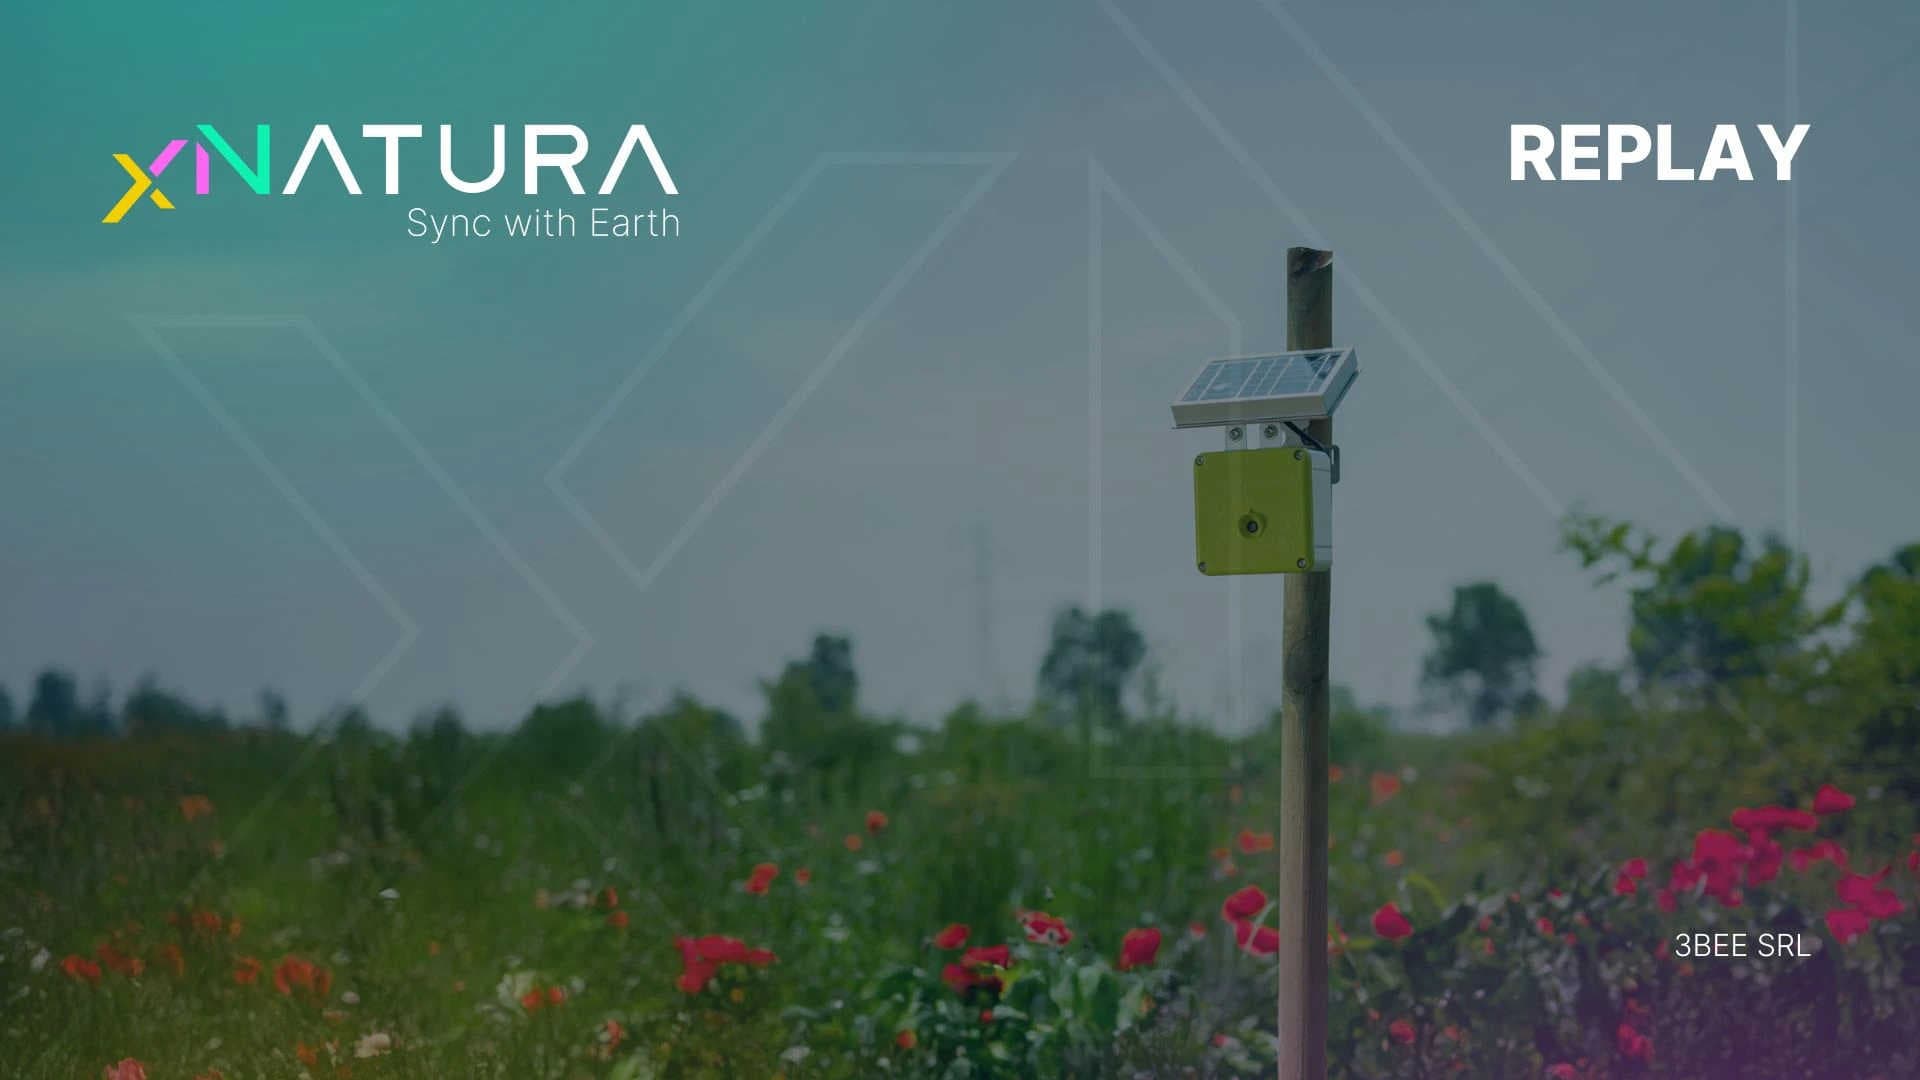
Nature & Biodiversity monitoring made easy - XNatura on-field sensors
    IntroductionXNaturaNature CreditsUNI/PdR

    Nature & Biodiversity monitoring made easy - XNatura on-field sensors

    Virginia Castellucci, Giorgio Puzzarini, and Chiara Di Cesare show how the XNatura platform and its sensors support environmental monitoring, improve EIA management, reduce biodiversity impacts, and ensure regulatory compliance, with a practical case study from Sammontana Italia.

    Read the article
    13/11/2025Of 3Bee, 3Bee
    101 Views
    13/11/2025Of 3Bee, 3Bee
    101 Views

    XNatura platform: IoT sensors for biodiversity monitoring

    In this article, Virginia Castellucci (Head of Sustainability, XNatura), Giorgio Puzzarini (Sustainability Specialist, XNatura) and Chiara Di Cesare (Head of Sustainability and Impact, Sammontana Italia) discuss how the XNatura platform and linked sensors support environmental monitoring. The session highlights practical solutions for monitoring environmental impacts and navigating the EIA permitting process efficiently. A live demo showcases real-world use cases, demonstrating how the platform supports long-term resilience, mitigates infrastructure impacts on biodiversity, and ensures compliance with evolving regulatory requirements. Finally, the session concludes with a practical case study of Sammontana Italia.
    What is XNatura?

    XNatura is a leading environmental platform focused on biodiversity monitoring and protection, offering technological solutions for assessment, monitoring, regeneration, and dissemination. With partnerships across over 15 research centers and scientific institutions globally, XNatura is present in more than 25 countries. The platform has over 500 customers and has deployed more than 5,000 IoT devices worldwide, currently mapping over one million hectares of land. As an in-house division of 3Bee, XNatura specializes in managing and monitoring environmental risks through data-driven insights, utilizing technologies like remote sensing, lab analysis, field sensors, and on-field surveys. The platform serves a wide range of users, including companies, municipalities, and natural parks, providing essential tools for decision-makers to effectively manage their environmental impacts.

    XNatura

    Roadmap for Nature Credits

    Important developments have emerged regarding nature credits. On July 7th, the European Union published a roadmap for nature credits, a system designed to encourage private investment in nature. These credits aim to address a significant biodiversity funding gap in Europe, estimated at €20 billion per year, with the goal of closing it by 2027, when the market is expected to be operational. Initiatives supported by EU funding, including the IEC fund, are already paving the way for the first biodiversity credit, planned for 2026, signaling a structured approach to mobilizing private resources for nature restoration and conservation.

    UNI/PdR: a methodological innovation

    Recent progress in biodiversity credit standards marks an important step forward. UNI, with XNatura contributions to the technical working group, released a new voluntary standard in the ISO family, UNI PDR 179/2025, which provides the methodology for issuing the first biodiversity credit. Published on September 23th, the standard introduces an innovative approach based on the Mean Species Abundance (MSA) index, a measure of how closely an area's biodiversity reflects its natural state. The document offers guidance for assessing and reducing an organization’s biodiversity footprint, designing environmental restoration projects capable of generating nature credits, and communicating commitments to nature in a transparent and verifiable manner.

    XNatura

    Structure of the standard and characteristics of a project

    The UNI PDR standard is structured in two parts. The first focuses on biodiversity footprint management and assessment, providing companies with practical guidance to quantify impacts and develop plans to enhance positive or reduce negative effects on nature. The second part provides guidelines for generating nature credits. Eligible projects fall into two categories: converting an enterprise area into a natural area, or minimizing the biodiversity footprint. Credits are calculated based on the following formula: ΔMSA x hectares x years x 10. Mandatory criteria include a minimum project duration of 15 years, a biodiversity plan, a monitoring plan, annual reporting, and validation by an independent third party to ensure credibility and the proper release of biodiversity credits.

    3Bee

    Platform benefits for environmental monitoring

    The platform provides comprehensive support for monitoring the impact of an area and generating nature credits, fully aligned with the UNI standard. While the UNI standard was published in Italy, it is part of the ISO family and can be applied globally. The platform enables companies to calculate impacts, generate credits, and access data on natural capital, digitalized for analysis and prioritization. It supports benchmark and target verification, development of site-specific or company-wide biodiversity action plans, scenario analysis, and transparent communication. Additionally, the platform integrates nature data into sustainability reporting in line with multiple standards, including TNFD, ESRS, and SBTN, facilitating consistent and verifiable reporting across frameworks.

    Nature is a pillar for sustainable business

    Nature plays a central role in business, forming the foundation of economic value. Companies engage with nature both as a risk management tool and as a long-term investment. Key motivations include risk and dependencies: businesses rely on natural resources and ecosystem services, while investors increasingly demand nature-related risk assessments and data before allocating funds. Consumer awareness also drives attention to nature, influencing both B2B and B2C markets. Additionally, regulatory frameworks such as CSRD and ESRS, including the E4 standard on biodiversity, require transparent reporting. Companies impact and depend on biodiversity through five main drivers of degradation: climate change, ecosystem use, overexploitation, invasive species, and pollution, while benefiting from essential services such as resource provision and ecosystem regulation, including pollination.

    How can XNatura help you building a nature strategy

    XNatura is a platform designed to support companies in building a comprehensive nature strategy. It integrates diverse data on biodiversity, nature, and climate, fully aligned with ESRS standards and the TNFD LEAP approach. The platform enables mapping of company assets and evaluation of both impacts and dependencies on nature, assessing and quantifying nature-related risks and opportunities through key indicators such as the Mean Species Abundance (MSA), which can also be used to generate nature credits. XNatura supports target setting based on industry benchmarks, control areas, or specific goals, such as regenerating 30% of natural areas in line with the Nature Restoration Law. The platform also facilitates transparent, traceable biodiversity reporting, ensuring reliable integration of nature data into sustainability reports.

    The XNatura IoT sensors: Spectrum

    Spectrum is an IoT sensor developed to detect and identify the flight frequencies of pollinators across different taxonomic levels. Using machine learning and pattern recognition, the system recognizes the type of pollinator based on specific frequency patterns measured in hertz; in essence, it “listens” to pollinators. The sensor collects quantitative data by counting the number of buzzes detected each hour, recording for twelve minutes during the day and four minutes at night to capture variations in pollinator activity throughout the day. All data are transmitted daily to the cloud via 4G, where they are processed to estimate local biodiversity levels. Pollinator abundance serves as a key indicator of the overall biodiversity and ecological health of the monitored area.

    Spectrum outputs and key applications

    Spectrum generates several key outputs: the annual average abundance value across all devices (main index), the weekly average, the annual average per insect class or pollinator cluster, and results for each group of sensors. Analyses can be done from single devices to entire networks. Key applications: - Regenerative agriculture: monitors pollinators as biodiversity indicators to assess ecosystem health and regenerative practices, supporting future nature credit generation. - Infrastructure projects: provides biodiversity KPIs for environmental assessments and permits. - CSR initiatives: tracks pollinator activity at company sites to strengthen reputation and sustainability reporting. - Renewable energy projects: quantifies ecosystem benefits of green infrastructures. - Urban green spaces: delivers insights into urban biodiversity and fosters community engagement.

    Hive-Tech technology

    HiveTech is an IoT sensor designed to monitor the vital parameters of bee colonies, enabling optimized hive management, reduced stress and mortality, improved animal welfare, and analysis of nectar availability in the surrounding environment. The device operates continuously, collecting and transmitting data on temperature, weight, humidity, and sound directly from within the hive. Mathematical models process these data to identify key events such as swarming and other behavioral patterns. Through this analysis, HiveTech provides a detailed picture of colony health, offering valuable insights into the well-being of bees and, more broadly, the overall condition of the surrounding ecosystem.

    Hive-Tech applications

    HiveTech analysis provides key outputs including the annual average reproduction value (main index across all devices), the monthly average to track seasonal changes, and metrics on temperature, humidity, hive weight, and other hive parameters. Use cases for HiveTech: - Agriculture: supports farmers in understanding pollination efficiency and optimizing crop management with real-time data. - Urban environments: monitors colonies for urban beekeeping, offers insights into urban biodiversity, and supports environmental education programs. - Honey production optimization: tracks nectar intake and colony activity to improve bee welfare and reduce stress, enhancing overall productivity.

    Polly X technology

    Polly X is an IoT sensor designed to monitor environmental parameters related to air quality, focusing on atmospheric particulate matter. Using laser-based digital sensors, it measures the density of PM2.5 and PM10 particles. Polly X is typically installed in the Pollihouse, a specially designed wooden shelter for wild bees. This setup provides a safe habitat for pollinators while enabling on-site data collection and analysis, offering insights into both air quality and pollinator activity in the surrounding environment.

    Polly X applications

    Polly X analysis provides key outputs including the annual average PM2.5 and PM10 values across all devices (main index), monthly averages, the number of days PM10 exceeds regulatory limits, and device-specific annual and monthly averages. Use cases for Polly X: - Urban biodiversity strategies: collects local air quality data to inform city planning and support pollinator-friendly initiatives. - Infrastructure and transportation: monitors air quality near highways and transport hubs. - Agriculture ecosystem assessment: tracks particulate matter in areas affected by dust or pesticide exposure, supporting ecosystem monitoring and management.

    Iot Camera

    The IoT camera is an environmental monitoring tool that combines infrared imaging, connectivity, and smart trap functionality to detect wildlife. Designed for remote areas, it is solar-powered, battery-operated, and does not require Wi-Fi or electricity. The camera uses infrared LEDs and motion detection to capture animal activity without disturbing fauna. Advanced visual recognition algorithms automatically identify species at multiple taxonomic levels, providing a powerful solution for biodiversity monitoring, ecological research, and long-term wildlife observation.

    Birdy technology

    Birdy is a bioacoustic sensor that identifies bird species through their vocalizations. It records ten minutes of audio per hour, day and night, storing data locally for upload to the 3Bee | XNatura Cloud, where machine learning algorithms automatically identify species. This provides quantitative data on migratory and protected birds. Key use cases for IoT cameras and Birdie: - Infrastructure projects: monitor wildlife around roads, railways, airports, and construction sites, supporting ecological impact assessments and mitigation planning, including bird activity monitoring for airport safety. - Energy projects: support solar, wind, and agrivoltaic installations by facilitating coexistence with wildlife and biodiversity management. - Urban spaces and national parks: enable continuous, non-invasive monitoring to guide conservation and management efforts.

    Survey and census

    The platform includes a dedicated section for surveys and census, allowing visualization, management, and uploading of all ground-verified data for specific sites. Observations from Biodiversa (an app for flora and fauna recognition) and iNaturalist are automatically integrated. Historical data from past monitoring, whether conducted by the company or other organizations, can also be imported. Uploads can be performed individually (photos or videos) or in bulk using CSV files, enabling seamless integration of multiple data sources for comprehensive biodiversity monitoring.

    Biodiversity and ecosystem monitoring with XNatura platform

    The platform is structured to provide a comprehensive view of biodiversity and ecosystem management. The overview section allows a brief description of the company and its activities. The monitoring section displays all sites and the supply chain, with the ability to navigate to specific site pages. A dedicated regeneration section tracks restoration efforts. Sensor-related features are integrated within the platform: on the site map, all deployed sensors are visible, and the sensor section provides access to detailed measurements. Key performance indicators, including MSA, land use, and other metrics, can be monitored and analyzed directly from the platform, offering a centralized tool for ecosystem monitoring and management.

    Detailed pollinator insights with Spectrum sensor data

    The sensor section of the platform provides detailed insights, including a dedicated interface for Spectrum. All detected pollinator clusters in the area are displayed and can be listened to, with data organized by frequency in hertz. Users can select specific sensors, spectra, and time periods for analysis. Graphs show the average monthly trend of registered pollinators in relation to temperature and precipitation, with options to view data on a monthly or yearly basis. All information can be downloaded as CSV files for reporting or internal use, and individual sensor data can also be accessed for precise, site-specific analysis.

    Wildlife and biodiversity monitoring with technology

    The platform also includes a dedicated survey and census section. For sites such as highways, all ground-verified data from various sensors can be visualized and managed. Data can be uploaded easily via single uploads (photos or videos with basic information like longitude and latitude) or bulk uploads using a CSV file template. Examples of uploaded data include multiple plant species identified through the Biodiversa app, as well as wildlife videos captured by IoT cameras. Recorded fauna include nocturnal activity of wild boars, herons, and wolves, illustrating the passage of wildlife under and around infrastructure and providing valuable insights for monitoring and conservation efforts.

    Species monitoring and data insights with Birdy sensor

    The same approach applies to Birdy as well. While Birdy records audio instead of video, it identifies species from vocalizations, providing species-level monitoring. The platform displays detailed statistics and integrates tools such as MSA and other KPIs. All data can be reviewed and edited in collaboration with nature strategists. Each KPI and data point includes its source, allowing users to trace back to original observations, comments, or statistics, ensuring transparency and reliability in biodiversity monitoring and reporting.

    Sammontana case study

    Sammontana, an Italian ice cream company, is integrating regeneration and biodiversity protection into its core business. The company’s approach goes beyond profit, aiming to generate positive impact for consumers, communities, and the environment. As a benefit corporation, Sammontana officially embeds social and environmental benefits into its business model. This framework underpins initiatives such as the Almond Code, reflecting the company’s commitment to sustainability, biodiversity, and long-term ecological responsibility.

    Sammontana Amando

    Sammontana’s journey into regeneration began with Amando, an ice cream made with Sicilian almond milk. Amando aligns with the company’s benefit corporation goals, particularly the Almond Code, and is designed to be inclusive, suitable for people who are lactose intolerant or have celiac disease. Beyond its nutritional benefits, Amando embodies a production approach that respects both people and nature. The almonds come from ISCC Plus-certified farms, ensuring traceability, reduced greenhouse gas emissions, and responsible land use. This approach enables Sammontana to integrate environmental, social, and economic responsibility in a concrete and measurable way.

    The Almond Code: regenerative and circular supply chain

    The Almond Code is structured around five main pillars: - Traceable raw materials to reduce emissions - Protection of biodiversity through active monitoring of almond orchards - Responsible water use - Circular economy, reusing waste and enhancing soil health - Fair value, ensuring benefits are shared transparently across the supply chain. This approach views the almond supply chain not just as production, but as an ecosystem capable of regeneration and shared value creation. Circularity is monitored through the Material Circularity Index (MCI) with external partners. Almond shells are reused for energy and composting, while pruned branches are left on the ground to enhance soil moisture. An MCI of 0.7 highlights how waste can be transformed into a resource.

    Biodiversity monitoring and data insights in almond farming

    Regarding natural capital, 3Bee conducted a biodiversity baseline study in a 44-hectare almond grove in Sicily. The land has been undisturbed for over 20 years, and the almond trees are fully adapted to the local climate, growing solely with rainfall and without irrigation. From a climate perspective, 18% of energy comes from renewable sources, and sustainable transportation is used. Choosing almond milk over cow’s milk reduces carbon emissions by approximately 26% over the product’s life cycle. Education and well-being are integral to the project: the Almond Code website shares data and best practices, and each product package includes a QR code allowing consumers to access the life cycle assessment and understand the impact of their choices.

    Continuous biodiversity monitoring in almond orchards

    The Almond Code aligns with the Fifteenth Sustainable Development Goal, which focuses on protecting and restoring terrestrial ecosystems and halting biodiversity loss. A quantitative monitoring system was introduced using remote sensing and IoT sensors with 3Bee to collect continuous data on vegetation health, species diversity, and water presence in almond orchards. From this data, three main biodiversity indicators are calculated: Mean Species Abundance (MSA), pollinator abundance, and nectar potential, providing insights into ecosystem health and resilience over time. The three-year monitoring program begins by maintaining current standards and progressively defines a biodiversity improvement plan with measurable goals and corrective actions, ensuring that biodiversity protection becomes a continuous, science-based process rather than a one-time certification.

    Almond Code: data-driven regeneration

    At the conclusion of the first stage, a regenerative profile was created to summarize progress across five dimensions: circularity, natural capital, climate, education, and well-being. Initial results show strong performance in circularity and education, while efforts continue to enhance natural capital and well-being. This data-driven approach guides the next steps toward deeper regeneration. Overall, the Almond Code goes beyond almonds or ice cream, demonstrating how regeneration and biodiversity protection can be integrated into business practices in a measurable and scalable way.

    White paper about XNatura IoT Sensors

    As a reminder, the white paper "Nature & Biodiversity Monitoring made easy" is available on the XNatura site. It serves as a practical guide that helps companies measure and improve their biodiversity impact, seize economic opportunities, stay ahead of regulatory changes, and build transparent sustainability strategies. You will find: - XNatura IoT sensors and technologies for biodiversity monitoring; - The new EU Roadmap for Nature Credits; - UNI/PdR 179/2025: the methodological innovation for Biodiversity Credits generation. Learn from real case studies: Sammontana S.p.A. Italia, Alce Nero S.p.a, Cubico Sustainable Investments, Parco delle Groane e della Brughiera Briantea.

    13/11/2025Of 3Bee, 3Bee
    101 Views
    Newsletter
    newsletter
    Subscribe to the Blog about bees and biodiversity