iLoveNatura Map Generator: monitoring biodiversity, carbon, and ESG
    IntroductionWhat does it do?Pro use cases

    iLoveNatura Map Generator: monitoring biodiversity, carbon, and ESG

    Discover the free Map Generator from iLoveNatura! With over 80 Copernicus layers, analyse biodiversity, carbon, and ESG. An essential tool for sustainability managers and consultants who want to measure environmental and corporate impact.

    Read the article
    12/05/2026Of 3Bee, 3Bee
    63 Views
    12/05/2026Of 3Bee, 3Bee
    63 Views

    Why Satellite Maps Are Needed and What the Generator Is

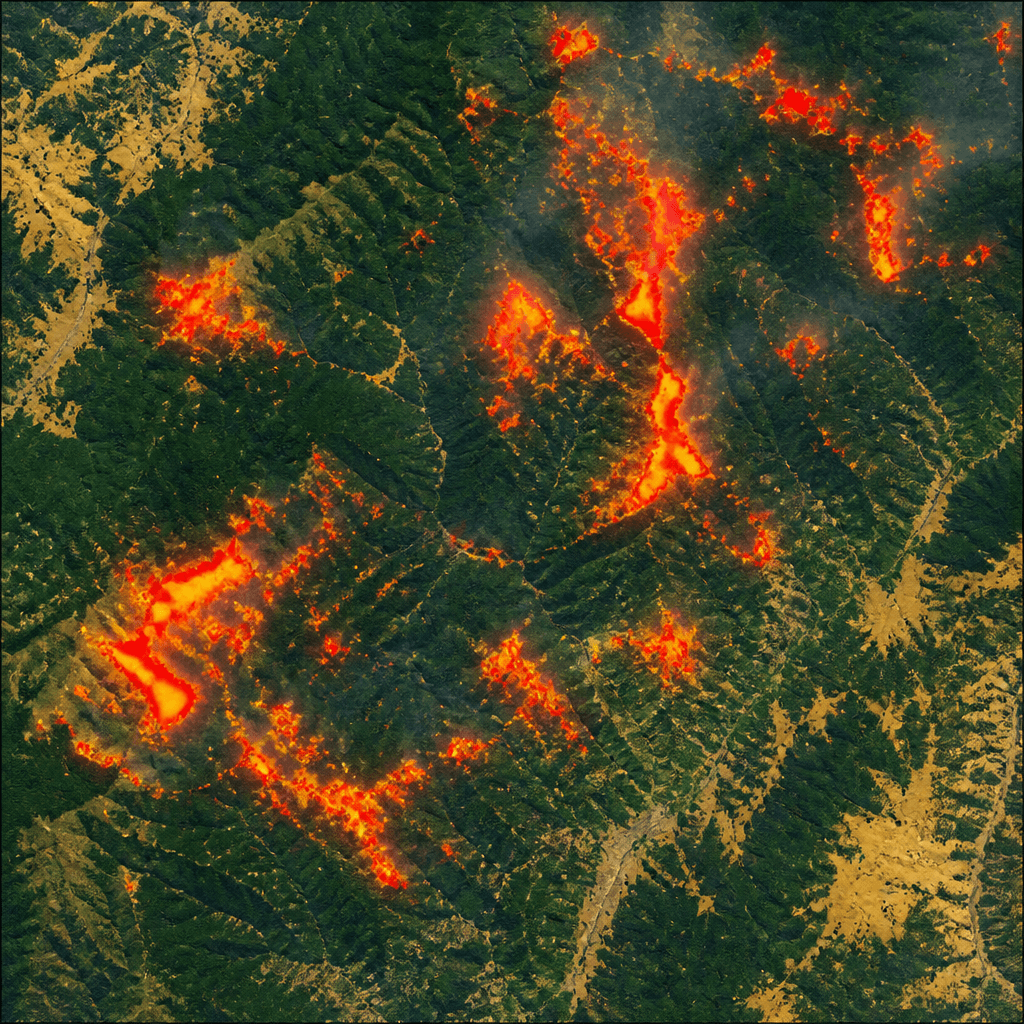
    Today, environmental consultants, sustainability managers, and companies face the growing need for geolocated environmental data. ESG reporting (CSRD), biodiversity due diligence (TNFD, SBTN), climate risk monitoring, and impact assessments require precise and accessible information. However, analysing this data with complex GIS software often poses a barrier, making it difficult to obtain a clear view of the territory. This is where the Map Generator by iLoveNatura comes into play. This free tool democratises access to environmental analysis, leveraging over 80 Copernicus satellite layers. It operates directly in the browser, eliminating the need for specialist desktop GIS software. It will allow you to quickly transform "I don't know what's in this territory" into an interactive map and a detailed PDF report, all in just a few clicks.
    Why Satellite Maps Are Needed and What the Generator Is

    Layer Copernicus: 80+ data sets, interactive maps and AI reports

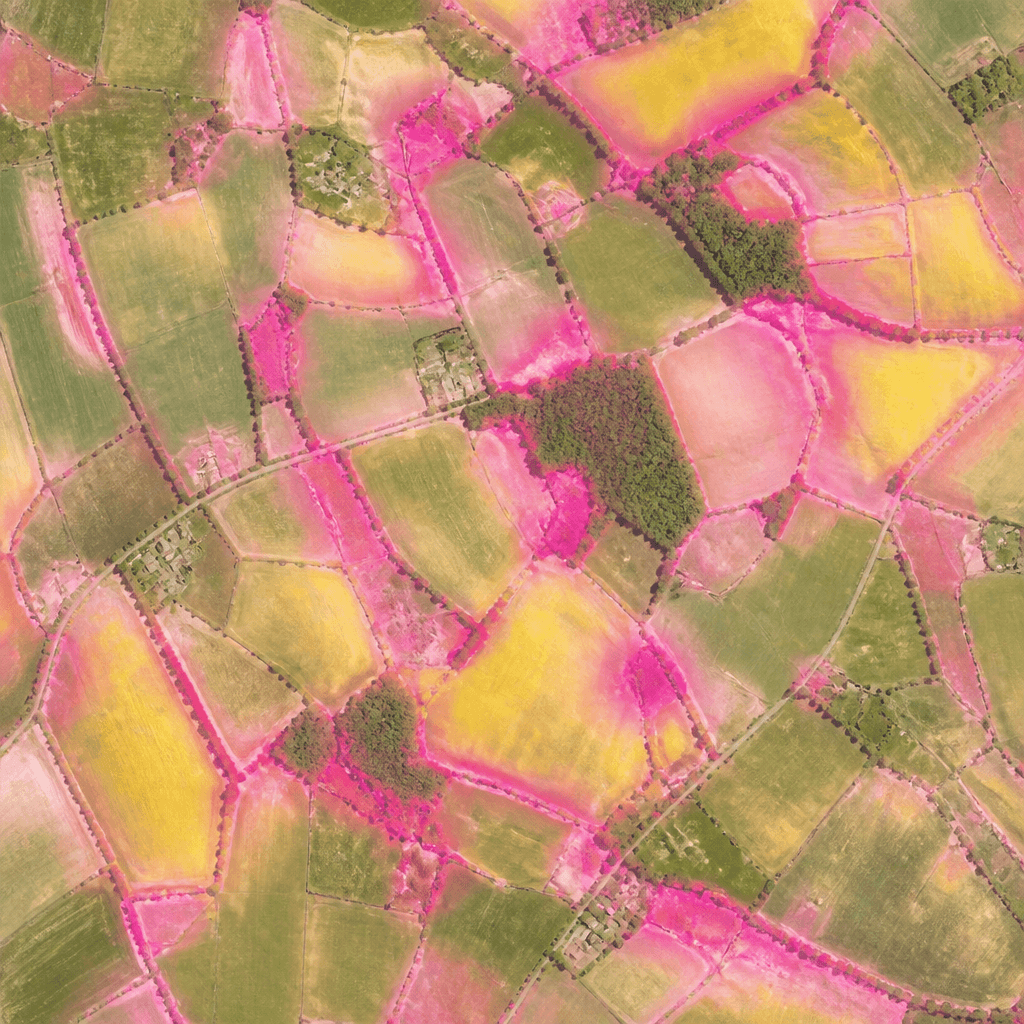
    The iLoveNatura Map Generator offers over 80 Copernicus satellite layers for detailed environmental analysis. Explore essential data grouped into:
    • Vegetation: Indices such as NDVI, NDWI, NDMI, monitoring plant health and their evolution.
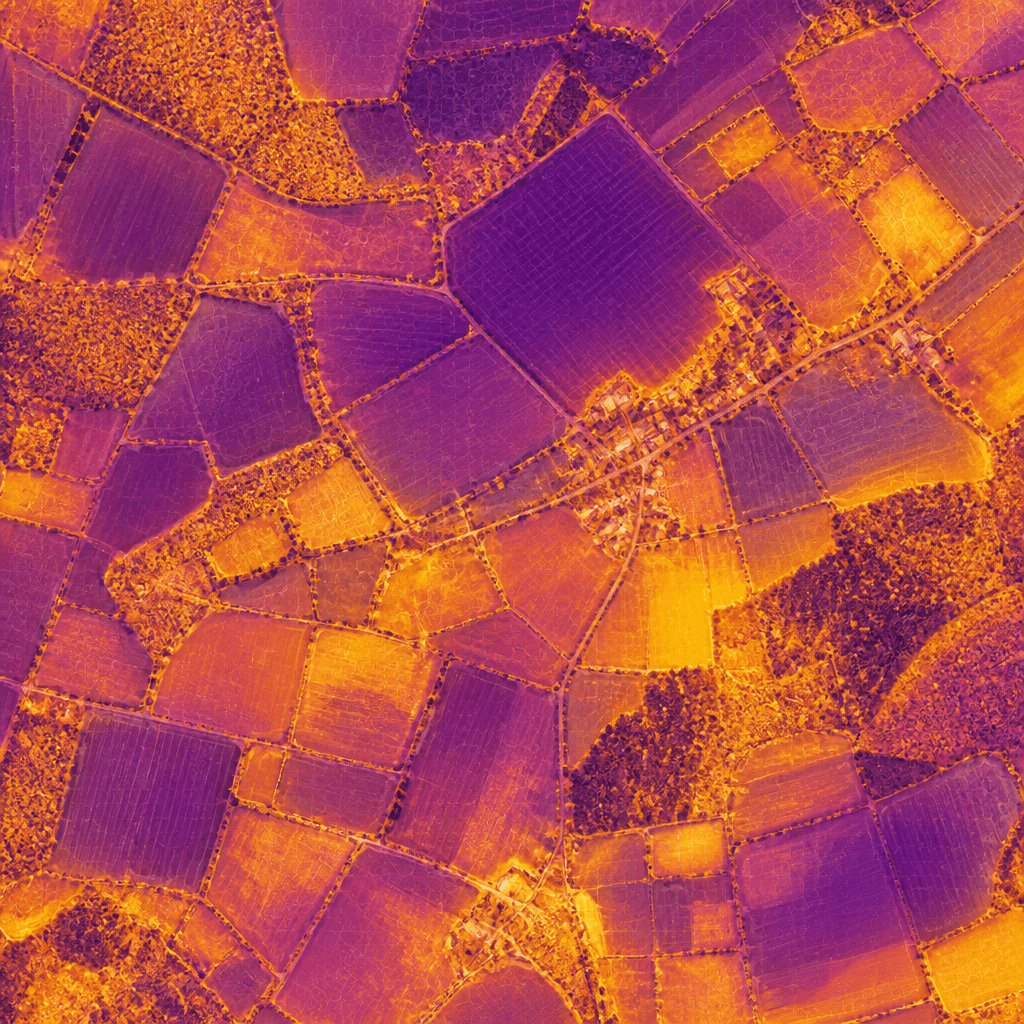
    • Urban climate: LST, heat islands, evapotranspiration and aridity to assess climate impact.
    • Biodiversity: Protected areas, ecological corridors, European ecosystems and green equity.
    • Carbon: Current stocks (AGB, BGB, SOC) and unrealised future potential for sustainability projects.
    • Air quality: NO2, CH4, CO, O3, light pollution and other factors.
    The output includes exportable interactive maps and an AI-generated PDF report that translates the data into a clear and shareable format. Access to the tool is free upon registration.
    Layer Copernicus: 80+ data sets, interactive maps and AI reports
    XNatura

    Use cases: consultants, sustainability managers, companies

    The iLoveNatura Map Generator is a strategic ally for professionals. Here's how it supports their activities:
    • The environmental consultant can produce impact studies for industrial areas. By using NDVI, land use, and biodiversity, it captures the pre-project state and evaluates temporal deltas, providing objective data.
    • The sustainability manager monitors urban heat islands and carbon stock for production sites. These are crucial data for sustainability reports (CSRD, GRI) and to demonstrate the company's environmental commitment.
    • For biodiversity due diligence (TNFD/SBTN), the tool maps protected areas, ecological corridors, and ecosystems. It helps identify risk hotspots in the supply chain or territories, guiding strategic decisions.
    This free tool is an excellent starting point. For advanced analyses, continuous monitoring, or integration with on-field sensors, 3Bee offers dedicated solutions. Try it and discover its operational value!
    Use cases: consultants, sustainability managers, companies
    12/05/2026Of 3Bee, 3Bee
    63 Views
    Newsletter
    newsletter
    Subscribe to the Blog about bees and biodiversity