Hydrogeological risk: the free tool to analyse any area
    The contextHow it worksWho needs it

    Hydrogeological risk: the free tool to analyse any area

    Floods, landslides, drought: hydrogeological risk is now a tangible issue for businesses and citizens. With the new free tool from iLoveNatura, you can analyse any area by cross-referencing WRI Aqueduct, GDACS/DFO flood events, and CMIP6 climate scenarios. AI summary in two clicks.

    Read the article
    03/06/2026Of 3Bee, 3Bee
    60 Views
    03/06/2026Of 3Bee, 3Bee
    60 Views

    An increasingly fragile Italy

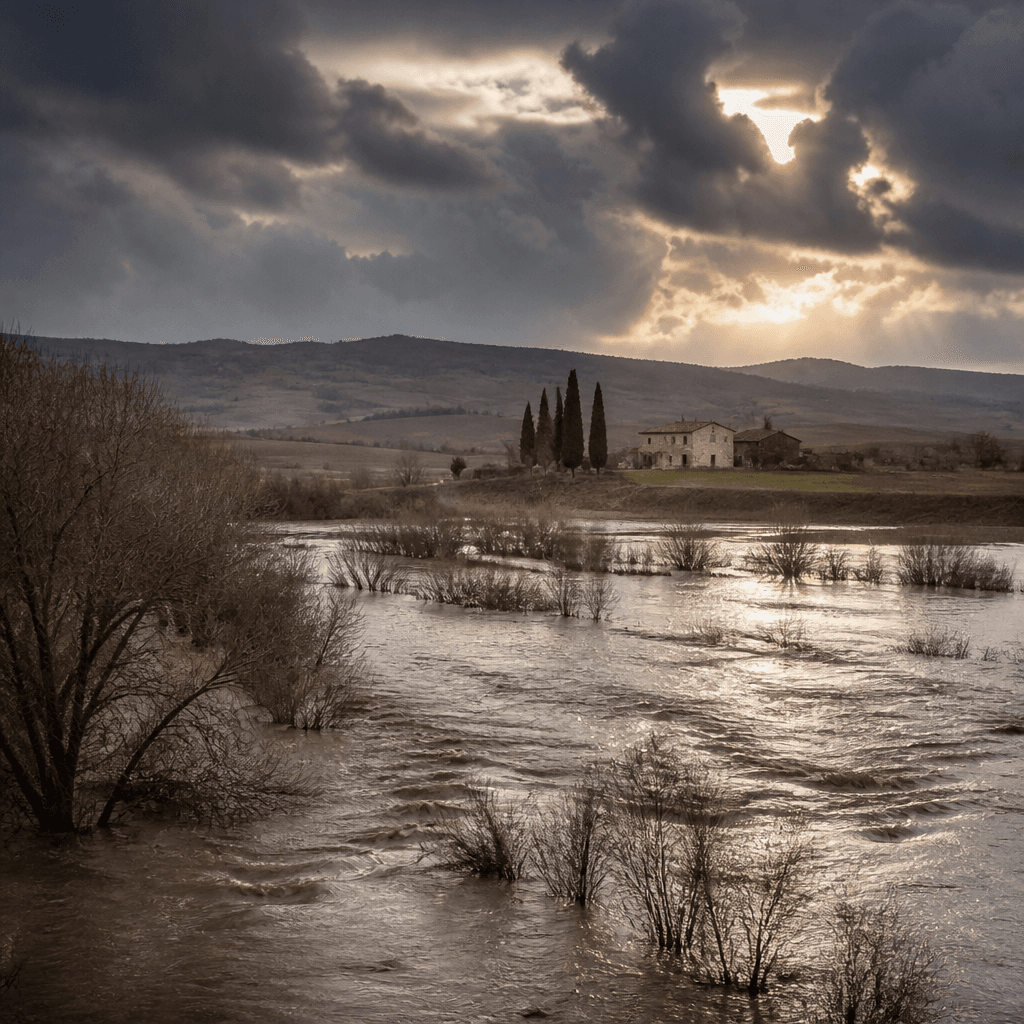
    Floods in Emilia-Romagna, landslides in Tuscany, prolonged droughts in the South: in recent years, Italy has learned the hard way how real and increasingly urgent the issue of hydrogeological risk is. Events that we considered exceptional just ten years ago are becoming commonplace. Data from ISPRA and IPCC reports converge: the exposure of Italian territory to water-related hazards has increased significantly, and the coming decades promise an intensification of these phenomena. Understanding where the fragility of the territory lies is no longer a matter for specialists alone, but a question that concerns businesses, administrations, and citizens. Those planning a new facility, managing a production site, or cultivating a plot of land all need to know what their location is exposed to, both now and in the next twenty years.
    An increasingly fragile Italy

    Three data sources, one map

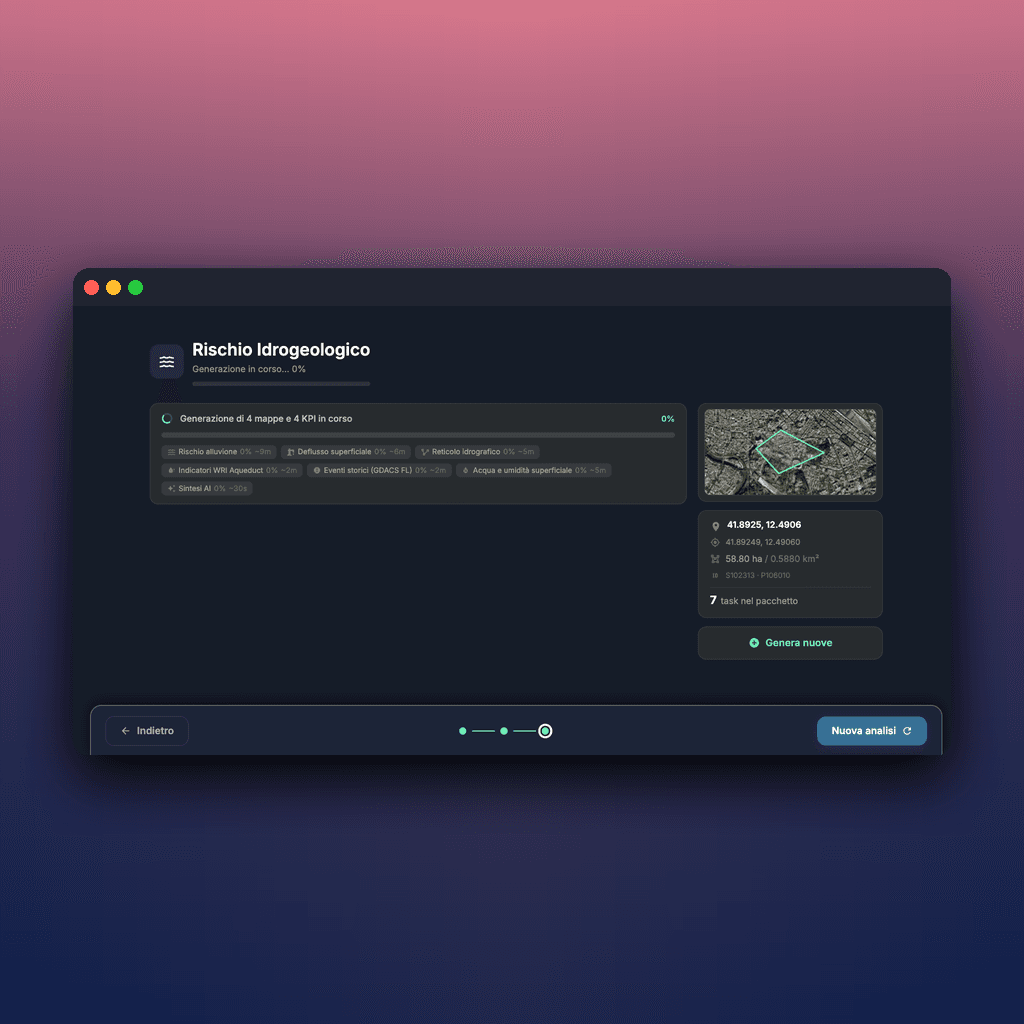
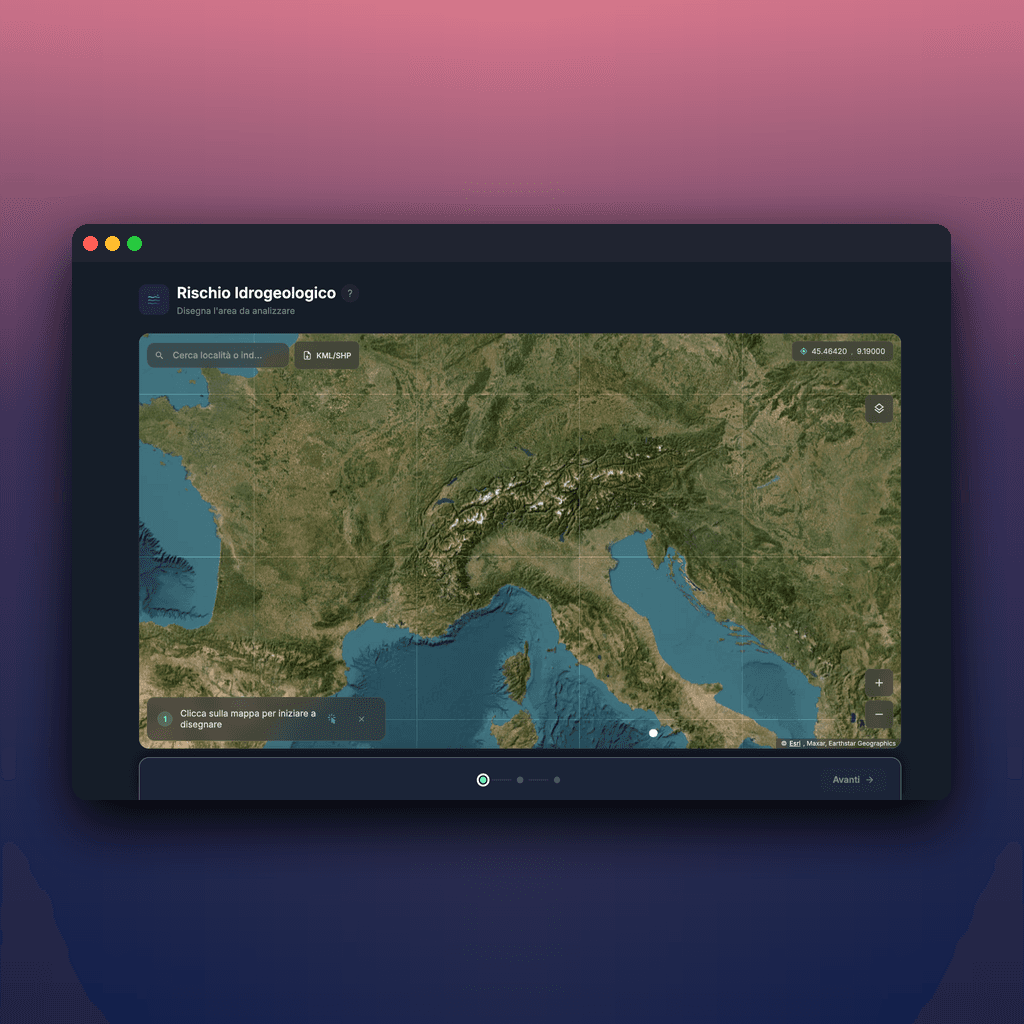
    Draw an area on the map — your company, a municipality, a farm plot — and within seconds you get a complete analysis. No registration, no cost.

    The analysis cross-references three sources of international reference data:

    • WRI Aqueduct: the World Resources Institute database, a standard for ESG reports of the Fortune 500. It measures water stress, flood exposure, and water quality.
    • GDACS and DFO: collect historical flood events globally. Predicted risk data is useful, but observed data tells a different story.
    • CMIP6: the latest cycle of IPCC climate simulations. It projects the scenario to 2050 and 2100 according to different emission pathways.
    In addition to maps and numbers, the tool produces a natural language summary generated by AI: it translates indicators into observations readable in three minutes, not three hours of analysis.
    Three data sources, one map
    XNatura

    For those who make decisions affecting a place

    The tool is designed for anyone who needs to make a decision related to a physical location.

    For companies that build their own sustainability reports (CSRD, TCFD, TNFD) and need to declare the physical exposure of their sites to climate risk. For risk management teams assessing suppliers, warehouses, and plants.

    For public administrations planning interventions in the area and seeking an initial screening before commissioning in-depth studies. For farmers and land managers who want to understand how their environment is changing.

    The final report is downloadable, shareable, and reproducible: the same area produces the same analysis over time, and the underlying data is publicly verifiable.

    Try it now: it takes just two minutes to outline the area and generate the first analysis. The climate won't wait — starting to measure it today is the first step to not being caught unprepared tomorrow.

    For those who make decisions affecting a place
    03/06/2026Of 3Bee, 3Bee
    60 Views
    Newsletter
    newsletter
    Subscribe to the Blog about bees and biodiversity